|
|
| HELP | |
| Alternatives in the market | |||||||||||||||||||||||||||||||||||||
Up to three companies listed in the same country are mentioned under the heading alternatives in the market.
To qualify as an alternative, a company must meet the following criteria: Rating fundamental / technical
with at least 3 stars; a historical risk moderate. (ou: "; a moderate historical risk.") |
|||||||||||||||||||||||||||||||||||||
| Alternatives in the sector | |||||||||||||||||||||||||||||||||||||
Up to three companies active in the same sector are mentioned under the heading alternatives in the sector .
To qualify as an alternative, a company must meet the following criteria: Rating fundamental / technical with
at least 3 stars; a historical risk moderate. (ou: "; a moderate historical risk.") |
|||||||||||||||||||||||||||||||||||||
| Bad News Factor | |||||||||||||||||||||||||||||||||||||
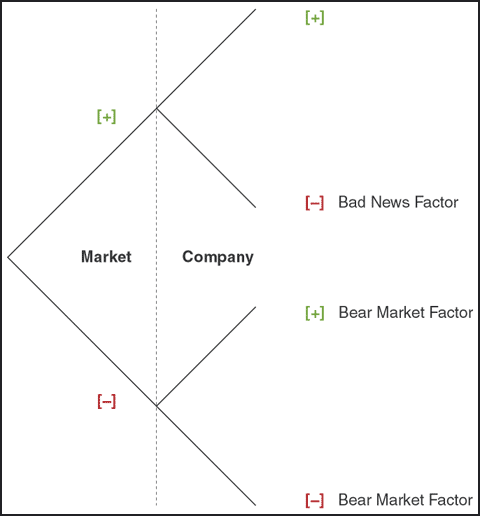
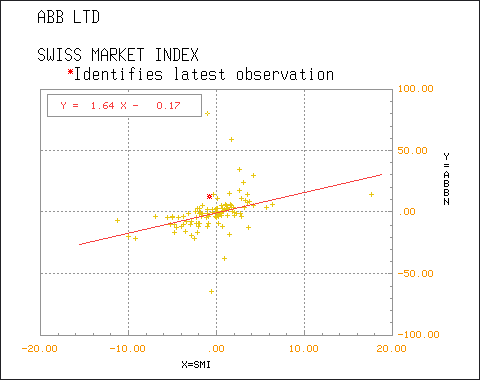
To determine the Bad News Factor we analyze a stock's declines in rising markets. In this purely objective analysis, the actual reasons for a stock's behavior are not important. If a stock price falls while its relative index goes up, it can be assumed that the stock's performance has been affected by bad news - hence the name, "Bad News Factor". How to interpret the Bad News Factor: In bi-weekly intervals that correspond to our updates, we track a stock's movement over the course of a standard sliding 52-week period. Each time the stock goes down while its reference index goes up, the percentage difference is calculated, absorbed into the yearly average and expressed in basis points as the Bad News Factor. As stocks rarely react in the same way the number used to calculate the average may differ from one stock to the next. For example, the number 114 would mean that during the last 12 months, each time UBS went down when the SMI went up, the average of the differences measured between the respective performances was 1.14%. Things to remember:
 |
|||||||||||||||||||||||||||||||||||||
| Bear Market Factor | |||||||||||||||||||||||||||||||||||||
To determine the Bear Market Factor we analyze the relationship between a stock's price movements and declining markets, hence the name, "Bear Market Factor". Ultimately then, the question that concerns us is: on the average, when the market declines, how does a stock tend to react? How to interpret the Bear Market Factor: Understanding Correlation: In bi-weekly intervals that correspond to our updates, we track an index's movement over the course of a standard sliding 52-week period. Each time the index goes down we calculate the percentage difference between it and each one of its individual stocks. This difference is then absorbed into the yearly average and expressed in basis points as the Bear Market Factor. Things to remember:
 |
|||||||||||||||||||||||||||||||||||||
| Beta 1 year in basis pts | |||||||||||||||||||||||||||||||||||||
Beta measures the sensitivity of a stock relative to market movements. By definition, the market has a Beta of 1.0. To be consistent with our other indicators, the number we use to express Beta is 100, which is equivalent to the number 1.0. Stocks with a Beta greater than 100 tend to amplify the overall movements of the market. Stocks with a Beta between 0 and 100 tend to move in the same direction as the market, but not as far. The market can be considered as the portfolio of all stocks, so the "average stock" has a Beta of 100.
 |
|||||||||||||||||||||||||||||||||||||
| Correlation | |||||||||||||||||||||||||||||||||||||
Correlation is a measure of the extent to which two random variables track one another.
Our system measures the correlation of a stock relative to its national index.
Example: on October 16, 2002, UBS has a correlation of 0.92. |
|||||||||||||||||||||||||||||||||||||
| Earnings Revision Trend | |||||||||||||||||||||||||||||||||||||
The symbol [
When the earnings revisions (7wk EPS Rev) fall between +1% and -1%, the trend is
considered to be neutral [ |
|||||||||||||||||||||||||||||||||||||
| Growth to PE Ratio | |||||||||||||||||||||||||||||||||||||
It is the basis of our Valuation Rating. This is the estimated growth of future earnings (LT Growth) plus dividend in %, divided by the estimated future PE ratio (Long Term P/E). Our G/PE Ratio measure is an index figure that compares firms on whether their stock is relatively "expensive" or "inexpensive" according to their potential earnings growth. We focus our attention on G/PE Ratio measures generally between 0.9 and 1.6, as this range of the index is most likely to include firms that will outperform their peers. A G/PE Ratio measure below 0.9 indicates that investors must pay a premium for the estimated growth potential; thus, the stock is relatively risky. |
|||||||||||||||||||||||||||||||||||||
| Group | |||||||||||||||||||||||||||||||||||||
The 4,500 stocks in theScreener.com's database are divided into 18 internationally recognized standard industry groups.
|
|||||||||||||||||||||||||||||||||||||
| Interest | |||||||||||||||||||||||||||||||||||||
In this easy-to-use rating system, stars are earned for each element specified below:
Therefore, a stock can earn a maximum of four stars. The lowest rating a stock can have is no stars. Note
|
|||||||||||||||||||||||||||||||||||||
| Long Term Growth | |||||||||||||||||||||||||||||||||||||
This is the estimated annual growth rate of future earnings, normally projected over the next two to three years, and expressed as a percentage. Our Long Term Growth measure is averaged over at least three different estimates obtained from banks, brokers, or analysts. A figure of 18 means that for the next two to three years, the growth in company earnings is evaluated at an average of 18% per year. Caution: Be skeptical of high long-term growth projections that differ greatly from growth rates of associated national market indexes or industry groups. These can often result from very low earnings for the most recent few years, thereby making a firm's projected earnings growth appear very strong by comparison with the lean years. To verify this information the aggregate analysis and world indexes functions can be very helpful. |
|||||||||||||||||||||||||||||||||||||
| Long Term P/E | |||||||||||||||||||||||||||||||||||||
It is the PE ratio calculated on the basis of estimates of long-term earnings. |
|||||||||||||||||||||||||||||||||||||
| Market Capitalization in $bn | |||||||||||||||||||||||||||||||||||||
This number is calculated by multiplying a firm's share price by the number of outstanding shares. |
|||||||||||||||||||||||||||||||||||||
| Medium Term Technical Trend | |||||||||||||||||||||||||||||||||||||
In order to offer a little more security in the selection of stocks, we have added a technical rating that we call a "Trend Follower". This is by no means a tool for detecting reversals in tendencies, but is simply a measure of the persistence of a given tendency. The column MT Tech Trend indicates the current tendency, positive [
When a price falls between 1.75% above or below the Tech Reverse, the MT Tech Trend is considered
neutral [
The symbol [
The MT Tech Trend can be thought of this way: if it is positive it indicates that the market currently "likes" (or, is buying) the stock. If it is negative it indicates that the market currently "does not like" (or, is selling) the stock. |
|||||||||||||||||||||||||||||||||||||
| Price | |||||||||||||||||||||||||||||||||||||
This is the price of a stock at the time of the latest update, and the currency that it is traded in. |
|||||||||||||||||||||||||||||||||||||
| Risk Zone | |||||||||||||||||||||||||||||||||||||
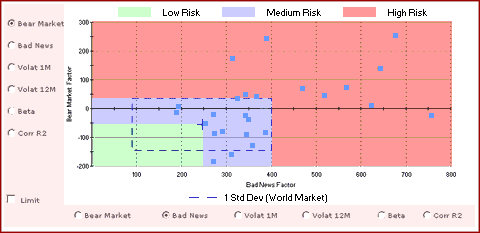
Risk zones are determined by measuring the Bear Market Factor and the Bad News Factor against the world reference. A stock will appear on the risk map as a single point created by plotting its Bear Market Factor on the Y axis and its Bad News Factor on the X axis. There are three types of risk zones:
 |
|||||||||||||||||||||||||||||||||||||
| Technical Reverse | |||||||||||||||||||||||||||||||||||||
This is the price at which we project the momentum to reverse. When a stock's price crosses over its technical reversal point, it can be an early signal for a potential buy or sell. |
|||||||||||||||||||||||||||||||||||||
| Valuation Rating | |||||||||||||||||||||||||||||||||||||
Our Valuation Rating indicates if a stock is selling at a relative premium or bargain price, based on its growth potential. To estimate a stock's value relative to its current price our Valuation Rating combines:
By combining these elements we can establish a rating for the analyzed company. There are five ratings, ranging from strongly undervalued [
When we analyze a company's projected earnings growth, we place a certain emphasis on the G/PE Ratio. While the first two elements in our analysis are important, and fairly simple to understand (stock price and earnings), the G/PE Ratio merits further explanation. Some analysts watch the PE (Price Earnings ratio) - the ratio of stock price divided by earnings per share. In general, this ratio is fairly linear: a low PE suggests an inexpensive/low-risk stock, while a high PE suggests an expensive/high-risk stock. In our model, the concepts of expensive/inexpensive do not depend on the PE, but on the relation between the PE and growth. Multifactor analysis has showed that the estimated growth of earnings provides the best base for the evaluation of a stock. There is approximately a 60% correlation of estimated earnings growth to stock value. Our Growth to PE Ratio measure quickly evaluates a company and detects firms that offer the greatest relative potential for the future and are therefore, the most undervalued. Correspondingly, our Growth to PE Ratio also detects firms that offer the least relative potential for the future and are thus, the most overvalued. Our Growth to PE Ratio measure conveniently compares two stocks at a glance. Our growth projections are always based on an average of at least three estimates. The moment an investor buys a stock, the stock's present situation becomes the past, and the success of the investment depends fully on the future. The Corporate focuses on the future in order to establish a true Valuation Rating. |
|||||||||||||||||||||||||||||||||||||
| Volatility | |||||||||||||||||||||||||||||||||||||
The volatility of a stock is its degree of random variability. A stock, which fluctuates widely over time, has high volatility. One, which is stable, has low volatility. Both short-term (1 month) and long-term (12 months) stock volatility figures are indicated. Low Volatility High Volatility |
|||||||||||||||||||||||||||||||||||||
| 4wk Rel Perf | |||||||||||||||||||||||||||||||||||||
This figure measures the performance of a stock relative to its national index (compared to four weeks ago). For example, a grade of 2 for a given stock would mean that this stock performed 2% better than its national index. On the contrary, a grade of -3 would indicate a performance of 3% under the index. We have chosen not to show the absolute performance, since the index remains the valid benchmark. For a given stock, figures that show an absolute gain of 2% in a market that also gained 2% do not represent any remarkable information. However, a stock that consistently beats its national index is clearly one sought after by investors. A chronic under-performance, of course, would indicate serious problems. In fact, we use 4 week Relative Performance compared to Earnings Revision Trend. A positive Earnings Revision Trend for a stock that does not show a positive 4 week Relative Performance rating should force the investor to question the pertinence of this revision. In the other direction, a stock with a negative Earnings Rev Trend that stills beats its index (4wk Rel Perf > 0) means that something special is happening with this stock, since investors are still buying it. |
|||||||||||||||||||||||||||||||||||||
| 7wk EPS Rev | |||||||||||||||||||||||||||||||||||||
This is an abbreviation for 7 week Earnings Per Share Revision. This column concerns the value of these revised earnings. A figure of 2.8 implies that the analysts, compared with seven weeks ago, have now revised and raised their estimates by 2.8%. On the contrary, a negative number means that the earnings were revised at a lower estimate. |
|||||||||||||||||||||||||||||||||||||