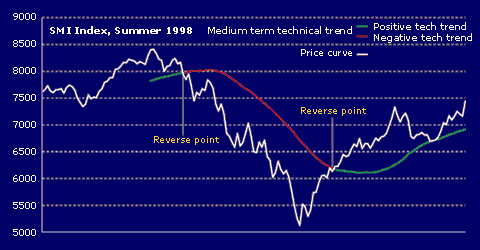
In order to offer a little more security in the selection of stocks, we have added a technical rating that we call a "Trend Follower".
This is by no means a tool for detecting reversals in tendencies, but is simply a measure of the persistence of a given tendency.
The column MT Tech Trend indicates the current tendency, positive [ ] or negative [
 ], and the column Tech Reverse indicates to which price this tendency is valid.
When a price falls between 1.75% above or below the Tech Reverse, the MT Tech Trend is considered
neutral [ ]. Once the price breaks out of the +1.75% neutral zone, the MT Tech Trend
will change to positive or negative depending on the movement.
The symbol [ ] indicates that the MT Tech Trend previous to the neutral situation
was positive.
The symbol [ ] indicates that the MT Tech Trend previous to the neutral situation
was negative.

The MT Tech Trend can be thought of this way: if it is positive it indicates that the market currently "likes" (or, is buying) the stock. If it is negative it indicates that the market currently "does not like" (or, is selling) the stock.