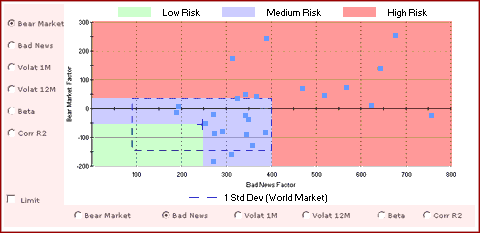
Risk zones are determined by measuring the Bear Market Factor and the Bad News Factor against the world
reference. A stock will appear on the risk map as a single point created by plotting its
Bear Market Factor on the Y axis and its Bad News Factor on the X axis.
There are three types of risk zones:
-
A low-risk zone is the area where the points are plotted on coordinates lower than the
average point of the world reference.
-
A medium-risk zone is the area where the points are plotted on coordinates higher than the
average point of the world reference, but lower than the point whose coordinates are
calculated by adding one standard deviation in both directions.
-
A high-risk zone is the area where the points are plotted on coordinates higher than the
point whose coordinates are calculated by adding one standard deviation in both directions
to the average point of the world reference.
